TESTIMONY, U.S. HOUSE COMMITTEE ON SCIENCE, SPACE & TECHNOLOGY
by John R. Christy, March 29, 2017
Summary
"Science" is not a set of facts but a process or method that sets out a way for us to discover information and which attempts to determine the level of confidence we might have in that information. In the method, a "claim" or "hypothesis" is stated such that rigorous tests might be employed to test the claim to determine its credibility. If the claim fails a test, the claim is rejected or modified then tested again. When the "scientific method" is applied to the output from climate models of the IPCC AR5, specifically the bulk atmospheric temperature trends since 1979 (a key variable with a strong and obvious theoretical response to increasing GHGs in this period), I demonstrate that the consensus of the models fails the test to match the real-world observations by a significant margin. As such, the average of the models is considered to be untruthful in representing the recent decades of climate variation and change, and thus would be inappropriate for use in predicting future changes in the climate or for related policy decisions.
The IPCC inadvertently provided information that supports this conclusion by (a) showing that the tropical trends of climate models with extra greenhouse gases failed to match actual trends and (b) showing that climate models without extra greenhouse gases agreed with actual trends. A report of which I was a co-author demonstrates that a statistical model that uses only natural influences on the climate also explains the variations and trends since 1979 without the need of extra greenhouse gases. While such a model (or any climate model) cannot "prove" the causes of variations, the fact that its result is not rejected by the scientific method indicates it should be considered when trying to understand why the climate does what it does. Deliberate consideration of the major influences by natural variability on the climate has been conspicuously absent in the current explanations of climate change by the well-funded climate science industry.
One way to aid congress in understanding more of the climate issue than what is produced by biased "official" panels of the climate establishment is to organize and fund credible "Red Teams" that look at issues such as natural variability, the failure of climate models and the huge benefits to society from affordable energy, carbon-based and otherwise. I would expect such a team would offer to congress some very different conclusions regarding the human impacts on climate.
I am John R. Christy, Distinguished Professor of Atmospheric Science, Alabama's State Climatologist and Director of the Earth System Science Center at The University of Alabama in Huntsville. I have served as Lead Author, Contributing Author and Reviewer of United Nations IPCC assessments, have been awarded NASA's Medal for Exceptional Scientific Achievement, and in 2002 was elected a Fellow of the American Meteorological Society.
It is a privilege for me to offer my analysis of the current situation regarding atmospheric temperature datasets and whether the traditional scientific method using these datasets has been applied in climate science regarding the pronouncements about climate change used in policy. I addressed other aspects of climate change including extreme events, crop production, impact of regulation (there is none on the climate) and data confidence in my last Senate (Commerce, Science and Transportation, 8 Dec 2015) and House (Science, Space and Technology, 2 Feb 2016) appearances.
My research area might be best described as building datasets from scratch to advance our understanding of what the climate is doing and why — an activity I began as a teenager over 50 years ago. I have used traditional surface observations as well as measurements from balloons and satellites to document the climate story. Many of our UAH datasets, generated by myself and UAH colleagues Drs. Roy Spencer and W. Daniel Braswell, are used to test hypotheses of climate variability and change.
(1) Applying the scientific method to climate models from the IPCC AR5
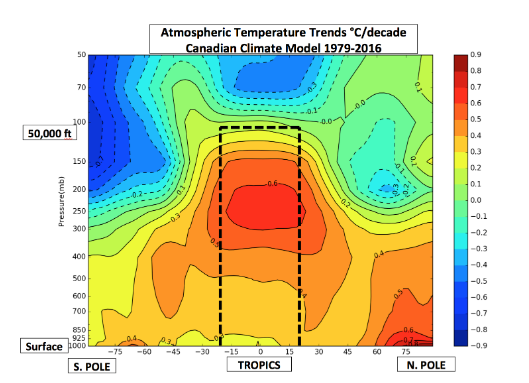
In my last appearance before this committee (2 Feb 2016) I addressed the active campaign of negative assertions made against the various sources of data we use to monitor the temperature of bulk atmosphere. I demonstrated that main assertions were incorrect and that we can have confidence in the observations and one reason was that we now have several independent sources from around the world providing data with which to intercompare. In this testimony I shall focus on the temperature of the bulk atmospheric layer from the surface to about 50,000 ft. — a layer which is often called by its microwave profile name TMT (Temperature of Mid-Troposphere). This layer is particularly important because it captures the atmospheric region that is anticipated to warm rapidly and unambiguously if greenhouse theory is well-understood. As such, if the impact of extra greenhouse gases (GHGs) is to be detected, it should be detected here. In Fig. 1 I show an example from a climate model simulation (Canadian Climate Model run CanESM2_rcp45_r3i1p1) of the anticipated temperature change for the period 1979-2016.
Figure 1 Temperature trends (°C/decade) for 1979-2016 of the cross-section of the atmosphere as simulated by the Canadian Climate Model. The tropical band (20°S-20°N) is outlined for the bulk layer (surface to 50,000 ft) that represents the microwave TMT measurement (Temperature Mid-Troposphere). This outlined-layer is the region of prominent warming for the 1979-2016 period as depicted in all models and thus is the region to examine relative to observations (Figure by Rob Junod, UAH). Figure 1 indicates that, according to theory, the tropical region should have experienced significant warming over the past 38 years due to extra GHGs. (There were 102 model runs to check and they all indicated a warming tropical atmosphere but to different degrees as shown later.) To test this result we follow the traditional scientific method in which a claim (hypothesis) is made and then is tested against independent information to see if the claim can be sustained or whether it is falsified. If the claim is confirmed, then we generally look for another test to confirm the claim again. If many tests are consistent with the claim, then we may have confidence in it. If the claim fails a test, we look for reasons why and modify or reject the original claim and start over. Since the thrust of this Hearing is to see how the scientific method was or was not applied in the pronouncements about climate science, this will serve as an excellent example because it deals with a foundational climate metric that should reveal significant change if theory is correct — the temperature of the bulk atmosphere.
(2) Observational data used to test climate models
Recall that the results from climate models are simply hypotheses (claims) about how the climate should have evolved in the past. The claim here is, "The bulk atmospheric temperature trend since 1979 of the consensus of the IPCC AR5 climate models represents the actual trend since 1979." (1979 is the beginning of the satellite temperature era.) To test this claim we compare the TMT model trends against TMT from several observational datasets. The first type of observational datatset is built from satellites that directly measure the bulk atmospheric temperature through the intensity of microwave emissions. These data are essentially global in coverage and monitor the Earth everyday. There are three sources, UAH (University of Alabama in Huntsville), RSS (Remote Sensing Systems, San Rafael CA) and NOAA.
The second type of measurement is produced from the ascent of balloons which carry various instruments including thermistors (which monitor the air temperature) as the balloon rises through this layer. From these measurements a value equivalent to the satellite TMT profile is calculated. Balloon stations are not evenly spaced throughout the Earth, but because the upper air is much more horizontally coherent in its features than the surface, a few balloons can represent a very large area in terms of temperature variability. The sources of these balloon datasets are RAOBCORE and RICH (University of Vienna, Austria), NOAA and UNSW (University of New South Wales, Australia).
Finally, major weather centers around the world generate atmospheric conditions every six hours or so of the entire Earth at many vertical levels, called Reanalyses. These products use many sources of data, including satellites and balloons, and merge the observations with a continuously running general circulation model. From the information at the vertical levels the TMT quantity is generated for an apples-to-apples comparison with models, satellites and balloons. The sources of the Reanalyses are ERA-I (European Centre for Medium-Range Weather Forecasts (ECMWF) — ReAnlaysis-Interim), NASAMERRAv2 and JRA-55 (Japan ReAnalyses). These three types of systems - satellites, balloons and reanalyses - represent very different means of computing the bulk atmospheric temperature and are provided by independent, international entities giving us confidence in the observational results.
(3) Testing the claim — applying the scientific method
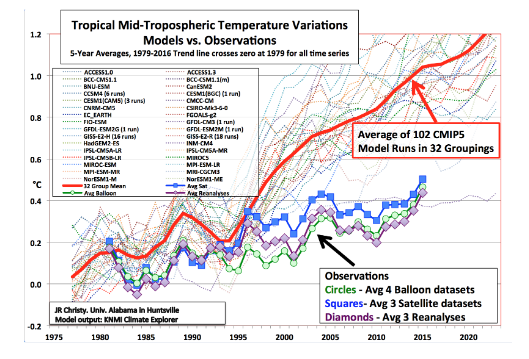
In Figure 2 we show the evolution of the tropical TMT temperature since 1979 for the 102 climate model runs grouped in 32 curves by institution. Some institutions contributed a single simulation, others as many as 18. Multiple runs from a single institution's model category were averaged into a single time series here. The curves show the temperature evolution of the atmosphere in the tropical box shown in Fig. 1.
Figure 2: Five-year averaged values of annual mean (1979-2016) tropical bulk TMT as depicted by the average of 102 IPCC CMIP5 climate models (red) in 32 institutional groups (dotted lines). The 1979-2016 linear trend of all time series intersects at zero in 1979. Observations are displayed with symbols: Green circles - average of 4 balloon datasets, blue squares - 3 satellite datasets and purple diamonds - 3 reanalyses. See text for observational datasets utilized. The last observational point at 2015 is the average of 2013-2016 only, while all other points are centered, 5-year averages. Here we have climate model results (i.e. "claims" or "hypotheses") to compare with observational datasets in a test to check whether the model average agrees with the observed data (i.e. the "claim" or "hypothesis".) We test the model average because it represents the consensus of the theoretical models and is used to develop policy which is embodied in policy-related products such as the Social Cost of Carbon, the National Climate Assessment and the EPA Endangerment Finding.
I provided the model and observational information as annual temperature anomalies (both tropical and global) to Dr. Ross McKitrick (University of Guelph) who has published extensively as an applied econometrician on the application of statistical techniques to the testing of climate hypotheses. He applied the Vogelsang-Franses F-Test method to these data as described in McKitrick, Ross R., S. McIntyre and C. Herman (2010) "Panel and Multivariate Methods for Tests of Trend Equivalence in Climate Data Sets", Atmosph. Sci. Lett., 11. DOI: 10.1002/asl.290. This method is particularly suitable for determining whether the trends of two time series are equivalent or significantly different. [The result found in their 2010 paper indicated model trends were significantly warmer than observations for the earlier datasets available at that time.]
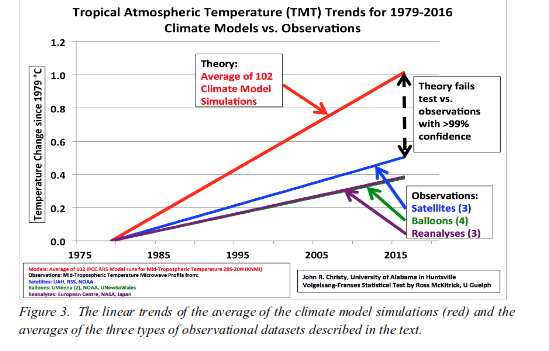
What we are really testing here are the rates of warming depicted by the models and the observations for the period 1979-2016. I have simplified a depiction of the test in Figure 3 so the rate of warming is directly viewed, showing what the test is measuring.
Figure 3. The linear trends of the average of the climate model simulations (red) and the averages of the three types of observational datasets described in the text. The basic test question is, "Is the red line significantly different from the others?" The results are shown in Table 1 recognizing that there is no equivalence between the model average trend and the observational datasets whenever the value of the test is greater than 84 at the <1% level. As shown, all test values exceed 84, and thus the mean model trend is highly significantly different from the observations.
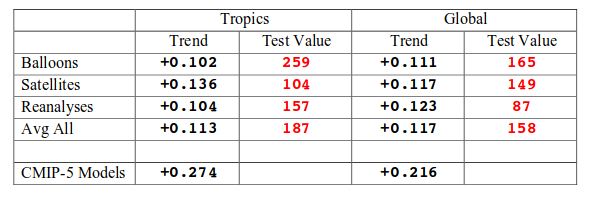
Table 1. Test for equivalence between the 1979-2016 trend of the mean of 102 CMIP-5 Climate Model simulations and the trends of various observational datasets. The test is the Vogelsang-Franses F-Test (see McKitrick et al. 2010) that indicates non-equivalence at the 99% confidence level for values greater than 84 and shown in red. All values in the various tests are significant at this level.
The scientific conclusion here, if one follows the scientific method, is that the average model trend fails to represent the actual trend of the past 38 years by a highly significant amount. As a result, applying the traditional scientific method, one would accept this failure and not promote the model trends as something truthful about the recent past or the future. Rather, the scientist would return to the project and seek to understand why the failure occurred. The most obvious answer is that the models are simply too sensitive to the extra GHGs that are being added to both the model and the real world.
[We do not use surface temperature as a testable metric because models, to varying degrees, are tuned to agree with the surface temperature observations already — i.e. they've been given the answer ahead of time - thus a comparison of the surface would not be a valid scientific test (Hourdin, F.T. et al., "The art and science of climate model tuning", 2016, doi:10.1175/BAMS-D-00135.1. and Voosen, P., "Climate scientists open up their black boxes to scrutiny", 2016, Science, 354, pp 401-402. DOI:10,1126/Science.354.6311.401).]
(4) The IPCC AR5 (2013) displayed a similar result — the models failed
Oddly enough, such an important result (i.e. that models fail the test of representing the real-world bulk temperature trend) was available to see in the most recent IPCC AR5.
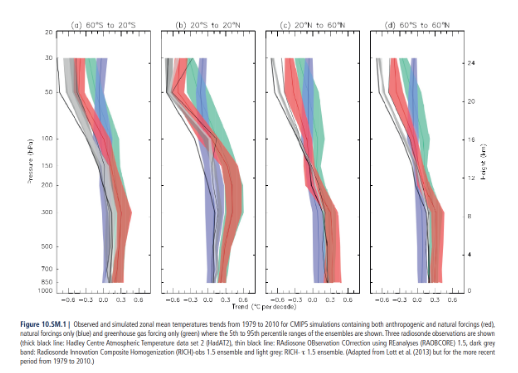
Unfortunately, it was buried in the Supplementary Material of Chapter 10 without comment. In Fig. 4, I present the figure that appeared in this IPCC section. I was a reviewer (a relatively minor position in that report) in the AR5 and had insisted that such a figure be shown in the main text because of its profound importance, but the government appointed lead authors decided against it. They opted to place it in the Supplementary Material where little attention would be paid, and to fashion the chart in such a way as to make it difficult to understand and interpret.
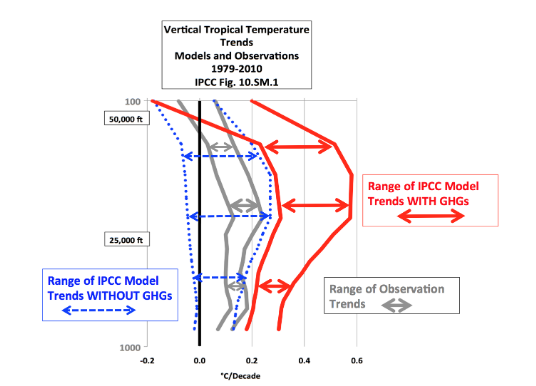
Figure 4. This is Fig. 10.SM.1 of the IPCC AR5 Supplementary Material for Chapter 10. These are trends (1979-2010) for various vertical levels of the atmosphere from (a) observations (gray band — difficult to see), from (b) models without extra GHGs (blue band) and (c) models with extra GHGs and other forcings (red band). The lower portion of the tropical chart (second panel from left) is simplified in Fig. 5 and used for the following discussion. I have taken the same information in Fig. 4 (IPCC AR5 Fig. 10.SM.1) and simplified the presentation so as to be clearer in Fig. 5 below. The trends here represent trends at different levels of the tropical atmosphere from the surface up to 50,000 ft. The gray lines are the bounds for the range of observations, the blue for the range of IPCC model results without extra GHGs and the red for IPCC model results with extra GHGs.
Figure 5. Simplification of IPCC AR5 shown above in Fig. 4. The colored lines represent the range of results for the models and observations. The key point displayed is the lack of overlap between the GHG model results (red) and the observations (gray). The nonGHG model runs (blue) overlap the observations almost completely. What is immediately evident is that the model trends in which extra GHGs are included lie completely outside of the range of the observational trends, indicating again that the models, as hypotheses, failed a simple "scientific-method" test applied to this fundamental, climate-change variable. That this information was not clearly and openly presented in the IPCC is evidence of a political process that was not representative of the dispassionate examination of evidence as required by the scientific method. Further, (and this took guts) the IPCC then claimed high confidence in knowing why the climate evolved as it did over the past few decades (humans as the main cause) ignoring the fact the models on which that claim was based had failed an obvious and rather easy-to-perform validation test. Incredibly, what Fig. 5 shows is that the bulk tropical atmospheric temperature change is modeled best when no extra GHGs are included — a direct contradiction to the IPCC conclusion that observed changes could only be modeled if extra GHGs were included.
(5) A simple statistical model that passed the same "scientific-method" test
The IPCC climate models performed best versus observations when they did not include extra GHGs and this result can be demonstrated with a statistical model as well. I was coauthor of a report which produced such an analysis (Wallace, J., J. Christy, and J. D'Aleo, "On the existence of a 'Tropical Hot Spot' & the validity of the EPA's CO2 Endangerment Finding — Abridged Research Report", August 2016 (Available here).
In this report we examine annual estimates from many sources of global and tropical deeplayer temperatures since 1959 and since 1979 utilizing explanatory variables that did not include rising CO2 concentrations. We applied the model to estimates of global and tropical temperature from the satellite and balloon sources, individually, shown in Fig. 2 above. The explanatory variables are those that have been known for decades such as indices of El Nino-Southern Oscillation (ENSO), volcanic activity, and a solar activity (e.g. see Christy and McNider, 1994, "Satellite greenhouse signal", Nature, 367, 27Jan). [One of the ENSO explanatory variables was the accumulated MEI (Multivariate ENSO Index, see here) in which the index was summed through time to provide an indication of its accumulated impact. This "accumulated-MEI" was shown to be a potential factor in global temperatures by Spencer and Braswell, 2014 ("The role of ENSO in global ocean temperature changes during 1955-2011 simulated with a 1D climate model", APJ.Atmos.Sci. 50(2), 229-237, DOI:10.1007/s13143-014- 001-z.) Interestingly, later work has shown that this "accumulated-MEI" has virtually the same impact as the accumulated solar index, both of which generally paralleled the rise in temperatures through the 1980s and 1990s and the slowdown in the 21st century. Thus our report would have the same conclusion with or without the "accumulated-MEI."]
The basic result of this report is that the temperature trend of several datasets since 1979 can be explained by variations in the components that naturally affect the climate, just as the IPCC inadvertently indicated in Fig. 5 above. The advantage of the simple statistical treatment is that the complicated processes such as clouds, ocean-atmosphere interaction, aerosols, etc., are implicitly incorporated by the statistical relationships discovered from the actual data. Climate models attempt to calculate these highly non-linear processes from imperfect parameterizations (estimates) whereas the statistical model directly accounts for them since the bulk atmospheric temperature is the response-variable these processes impact. It is true that the statistical model does not know what each sub-process is or how each might interact with other processes. But it also must be made clear: it is an understatement to say that no IPCC climate model accurately incorporates all of the non-linear processes that affect the system. I simply point out that because the model is constrained by the ultimate response variable (bulk temperature), these highly complex processes are included.
The fact that this statistical model explains 75-90 percent of the real annual temperature variability, depending on dataset, using these influences (ENSO, volcanoes, solar) is an indication the statistical model is useful. In addition, the trends produced from this statistical model are not statistically different from the actual data (i.e. passing the "scientific-method" trend test which assumes the natural factors are not influenced by increasing GHGs). This result promotes the conclusion that this approach achieves greater scientific (and policy) utility than results from elaborate climate models which on average fail to reproduce the real world's global average bulk temperature trend since 1979.
The over-warming of the atmosphere by the IPCC models relates to a problem the IPCC AR5 encountered elsewhere. In trying to determine the climate sensitivity, which is how sensitive the global temperature is relative to increases in GHGs, the IPCC authors chose not to give a best estimate. [A high climate sensitivity is a foundational component of the last Administration's Social Cost of Carbon.] The reason? ... climate models were showing about twice the sensitivity to GHGs than calculations based on real, empirical data. I would encourage this committee, and our government in general, to consider empirical data, not climate model output, when dealing with environmental regulations.
(6) Red Teams needed because Consensus Science is not Science
One way for congress to receive better (less biased) information about claims of climate science is to organize "Red Teams" as is done in other parts of government and industry when critical systems, programs or infrastructure are under consideration. I have discussed this idea is several previous congressional hearings. I will include here the section describing Red Teams from my testimony on 20 Sep 2012 before the Subcommittee on Energy and Power of the House Committee on Energy and Commerce:
The term "consensus science" will often be appealed to regarding arguments about climate change to bolster an assertion. This is a form of "argument from authority." Consensus, however, is a political notion, not a scientific notion. As I testified to the Inter-Academy Council in June 2010, wrote in Nature that same year (Christy 2010), and documented in my written House Testimony last year (House Space, Science and Technology, 31 Mar 2011) the IPCC and other similar Assessments do not represent for me a consensus of much more than the consensus of those selected to agree with a particular consensus. The content of these climate reports is actually under the control of a relatively small number of individuals - I often refer to them as the "climate establishment" — who through the years, in my opinion, came to act as gatekeepers of scientific opinion and information, rather than brokers. The voices of those of us who object to various statements and emphases in these assessments are by-in-large dismissed rather than accommodated. This establishment includes the same individuals who become the "experts" called on to promote IPCC claims in government reports such as the Endangerment Finding by the Environmental Protection Agency. As outlined in my [31 Mar 2011] House Testimony, these "experts" become the authors and evaluators of their own research relative to research which challenges their work. But with the luxury of having the "last word" as "expert" authors of the reports, alternative views vanish.
I've often stated that climate science is a "murky" science. We do not have laboratory methods of testing our hypotheses as many other sciences do. As a result what passes for science includes, opinion, arguments-from-authority, dramatic press releases, and fuzzy notions of consensus generated by preselected groups. This is not science.
I noticed the House passed an amendment last year to de-fund the U.N.'s Intergovernmental Panel on Climate Change (IPCC.) We know from Climategate emails and many other sources that the IPCC has had problems with those who take different positions on climate change than what the IPCC promotes. There is another way to deal with this however. Since the IPCC activity is funded by US taxpayers, then I propose that five to ten percent of the funds be allocated to a group of well-credentialed scientists to produce an assessment that expresses legitimate, alternative hypotheses that have been (in their view) marginalized, misrepresented or ignored in previous IPCC reports (and thus EPA and National Climate Assessments). Such activities are often called "Red Team" reports and are widely used in government and industry. Decisions regarding funding for "Red Teams" should not be placed in the hands of the current "establishment" but in panels populated by credentialed scientists who have experience in examining these issues. Some efforts along this line have arisen from the private sector (i.e. The Non-governmental International Panel on Climate Change at http://nipccreport.org/ and Michaels (2012) ADDENDUM:Global Climate Change Impacts in the United States). I believe policymakers, with the public's purse, should actively support the assembling all of the information that is vital to addressing this murky and wicked science, since the public will ultimately pay the cost of any legislation alleged to deal with climate.
Topics to be addressed in this "Red Team" assessment, for example, would include (a) evidence for a low climate sensitivity to increasing greenhouse gases, (b) the role and importance of natural, unforced variability, (c) a rigorous and independent evaluation of climate model output, (d) a thorough discussion of uncertainty, (e) a focus on metrics that most directly relate to the rate of accumulation of heat in the climate system, (f) analysis of the many consequences, including benefits, that result from CO2 increases, and (g) the importance that affordable and accessible energy has to human health and welfare.
What this proposal seeks is to provide to the Congress and other policymakers a parallel, scientifically-based assessment regarding the state of climate science which addresses issues which here-to-for have been un- or under-represented by previous tax-payer funded, government-directed climate reports. In other words, our policymakers need to see the entire range of findings regarding climate change.
(7) In Summary
"Science" is not a set of facts but a process or method that sets out a way for us to discover information and which attempts to determine the level of confidence we might have in that information. In the method, a "claim" or "hypothesis" is stated such that rigorous tests might be employed to test the claim to determine its credibility. If the claim fails a test, the claim is rejected or modified then tested again. When the "scientific method" is applied to the output from climate models of the IPCC AR5, specifically the bulk atmospheric temperature trends since 1979 (a key variable with a strong and obvious theoretical response to increasing GHGs in this period), I demonstrate that the consensus of the models fails the test to match the real-world observations by a significant margin. As such, the average of the models is considered to be untruthful in representing the recent decades of climate variation and change, and thus would be inappropriate for use in predicting future changes in the climate or for related policy decisions.
The IPCC inadvertently provided information that supports this conclusion by (a) showing that the tropical trends of climate models with extra greenhouse gases failed to match actual trends and (b) showing that climate models without extra greenhouse gases agreed with actual trends. A report of which I was a co-author demonstrates that a statistical model that uses only natural influences on the climate also explains the variations and trends since 1979 without the need of extra greenhouse gases. While such a model (or any climate model) cannot "prove" the causes of variations, the fact that its result is not rejected by the scientific method indicates it should be considered when trying to understand why the climate does what it does. Deliberate consideration of the major influences by natural variability on the climate has been conspicuously absent in the current explanations of climate change by the well-funded climate science industry.
One way to aid congress in understanding more of the climate issue than what is produced by biased "official" panels of the climate establishment is to organize and fund credible "Red Teams" that look at issues such as natural variability, the failure of climate models and the huge benefits to society from affordable energy, carbon-based and otherwise. I would expect such a team would offer to congress some very different conclusions regarding the human impacts on climate.
Dr. John R. Christy is the Distinguished Professor of Atmospheric Science and Director of the Earth System Science Center at the University of Alabama in Huntsville where he began studying global climate issues in 1987. Since 2000 he has been Alabama's State Climatologist. In 1989 Dr. Roy Spencer (then a NASA scientist and now a Principle Research Scientist at UAH) and Christy developed a global temperature data set from satellite microwave data beginning in 1979. For this achievement, the Spencer-Christy team was awarded NASA's Medal for Exceptional Scientific Achievement in 1991. In 1996, they were selected to receive a Special Award by the American Meteorological Society "for developing a global, precise record of earth's temperature from operational polar-orbiting satellites, fundamentally advancing our ability to monitor climate." In January 2002 Christy was inducted as a Fellow of the American Meteorological Society. Dr. Christy has served as Lead Author (2001) and Contributor/Reviewer (1992, 1994, 1996, 2007, 2013) for the U.N. reports by the Intergovernmental Panel on Climate Change in which the satellite temperatures were included for studying global climate change. He has served on five NRC and NAS panels and has performed research funded by NASA, NOAA, DOE, DOT and the State of Alabama, publishing many studies appearing in, for example, Science, Nature, Journal of Climate and The Journal of Geophysical Research.
This article was published by the U.S. House Committee on Science, Space & Technology March 29, 2017 and is archived at
https://science.house.gov/sites/republicans.science.house.gov/files/documents/HHRG-115-SY-WS It is archived at Think-Israel at
http://www.think-israel.org/christy.congresstestimony.html